
MetersBoardUtility tier · enterprise MDM platform

See every unit. Bill every unit.

An open meter data management platform that cuts AT&C losses and recovers DISCO revenue — built for Pakistan’s power sector, configurable for any grid.

Book a Demo
What an MDM is

The meter records. The platform decides what it means.

A meter produces readings. It cannot tell you whether they are complete, whether they reconcile against the feeder above them, or which of them are worth sending an inspector to. That work is a different system with a different lifetime.
Readings arrive incomplete. Validation, editing and estimation fill the gaps before anything is billed.
A meter cannot reconcile itself against the feeder above it. Loss is computed where both numbers meet.
Meters come from many vendors in phases. The platform is multi-vendor by design, with or without a head-end system.
Billing, GIS, outage and field systems all need the same validated stream. That is an integration job, not a meter job.
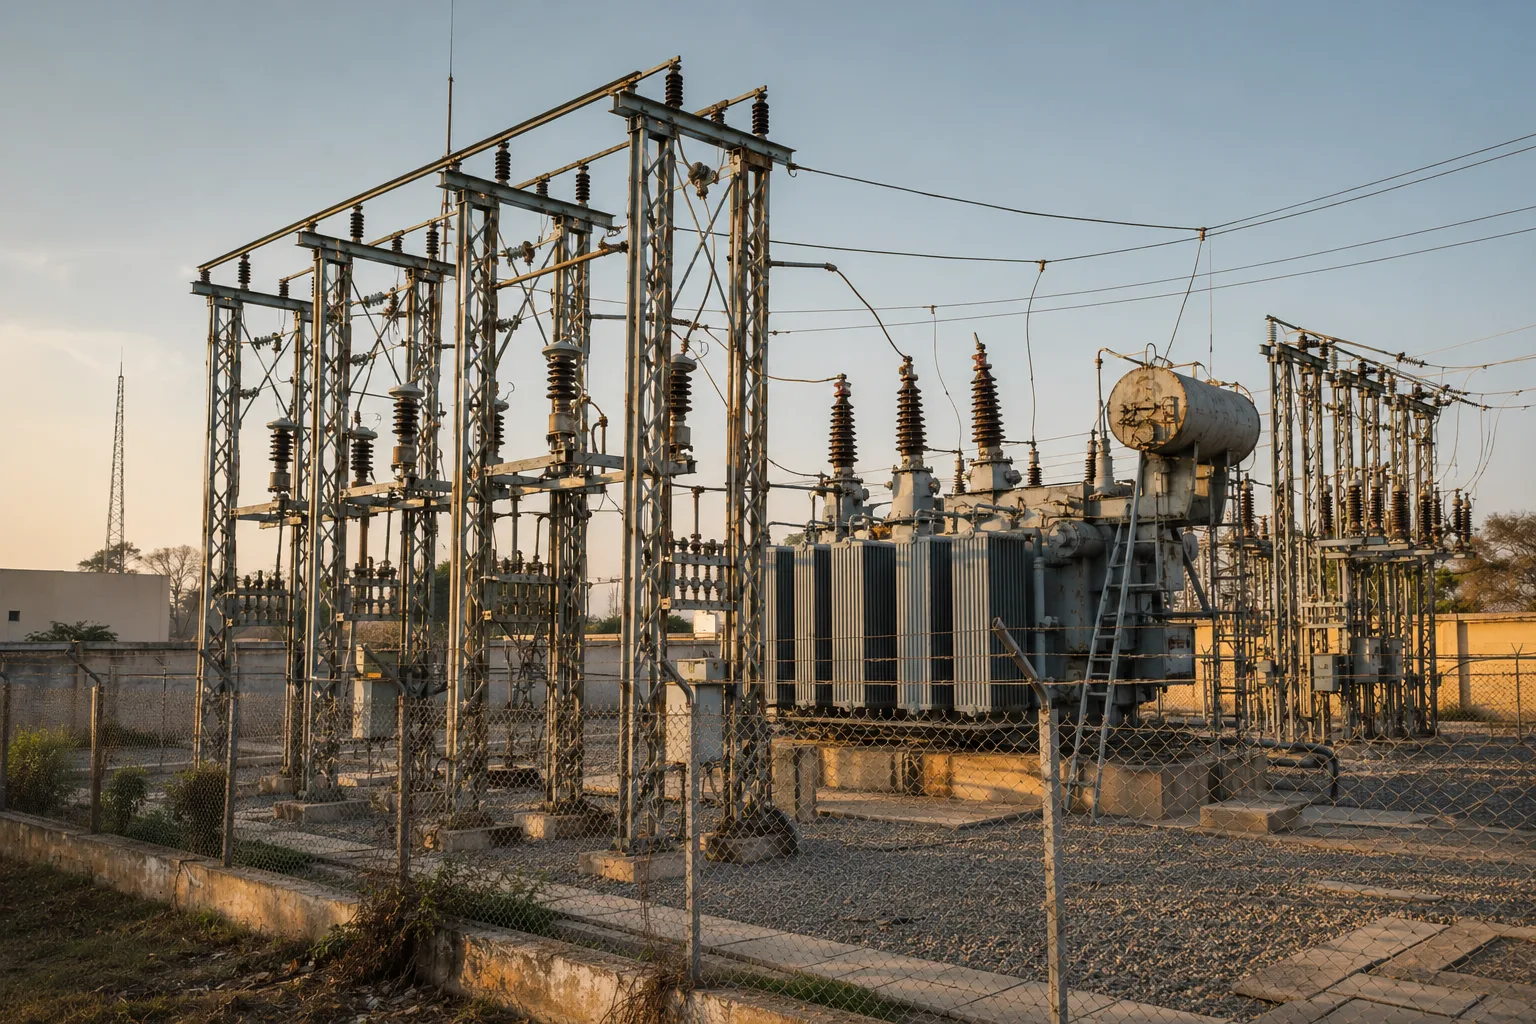
A distribution substation at dusk — transformers, gantries and insulators against the sky
Above the meter. Loss is computed where the feeder number and the billing number meet.

What operations actually looks like

Live instance · representative network
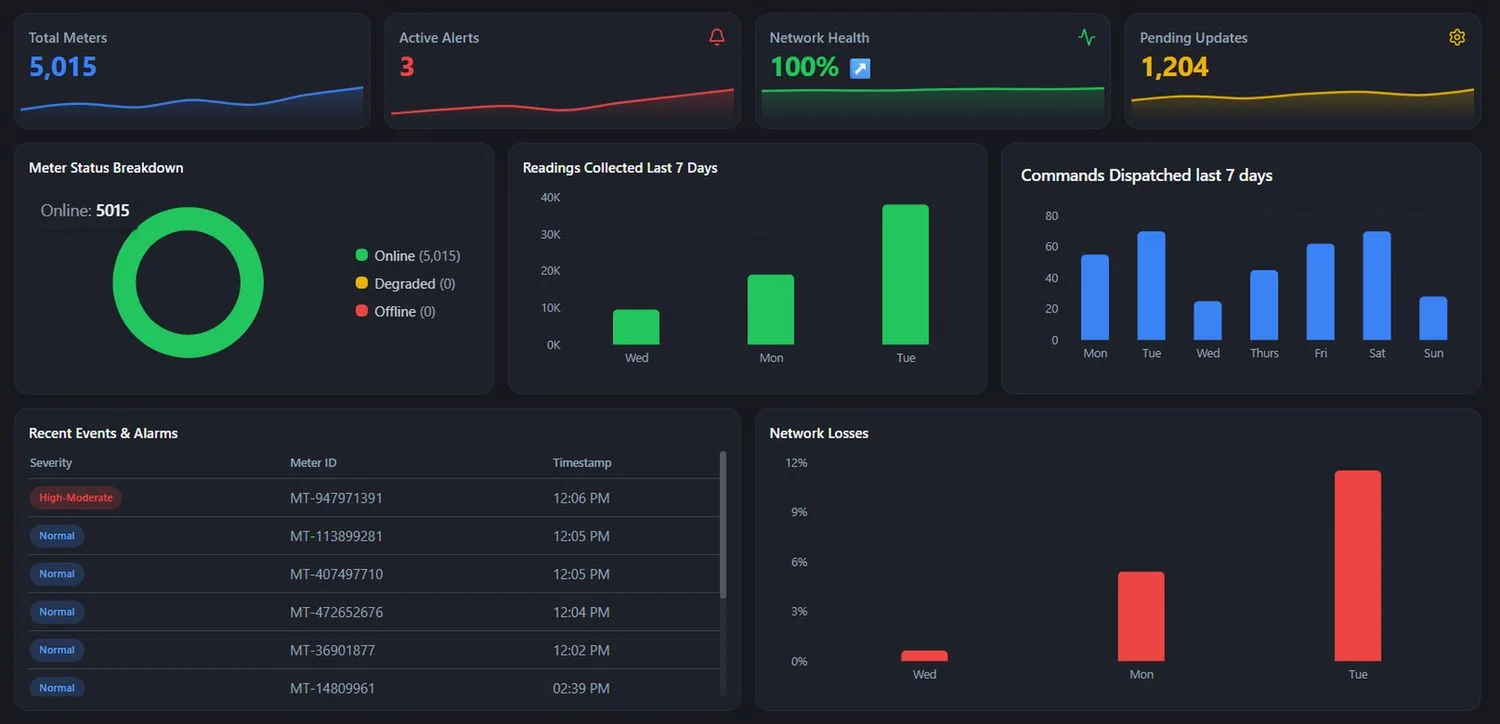
The MetersBoard operations dashboard — total meters, active alerts, network health, meter status breakdown, readings collected over seven days, recent events and alarms, and network losses
Operations dashboard. The whole network on one screen — meters online, readings collected, commands dispatched, live alarms and network losses.
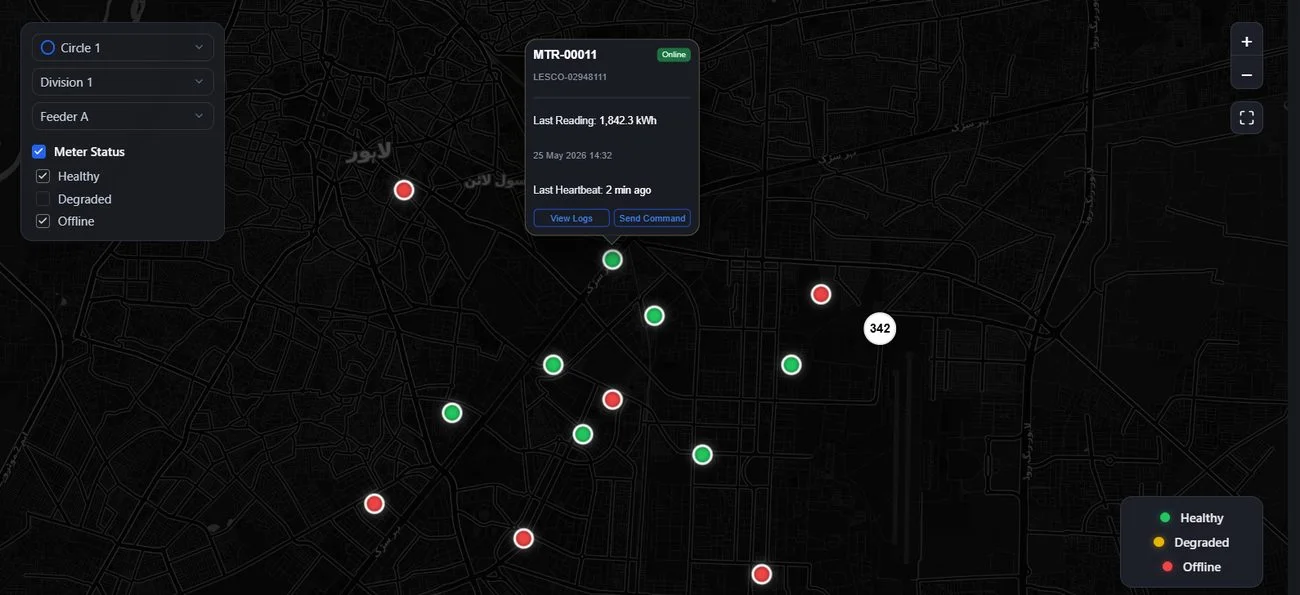
The MetersBoard GIS view — meters plotted across Lahore, filtered by circle, division and feeder, with a selected meter showing its last reading and heartbeat
Meters GIS. Every meter on the map with its live status, filtered by circle, division and feeder — field crews go straight to the right address.
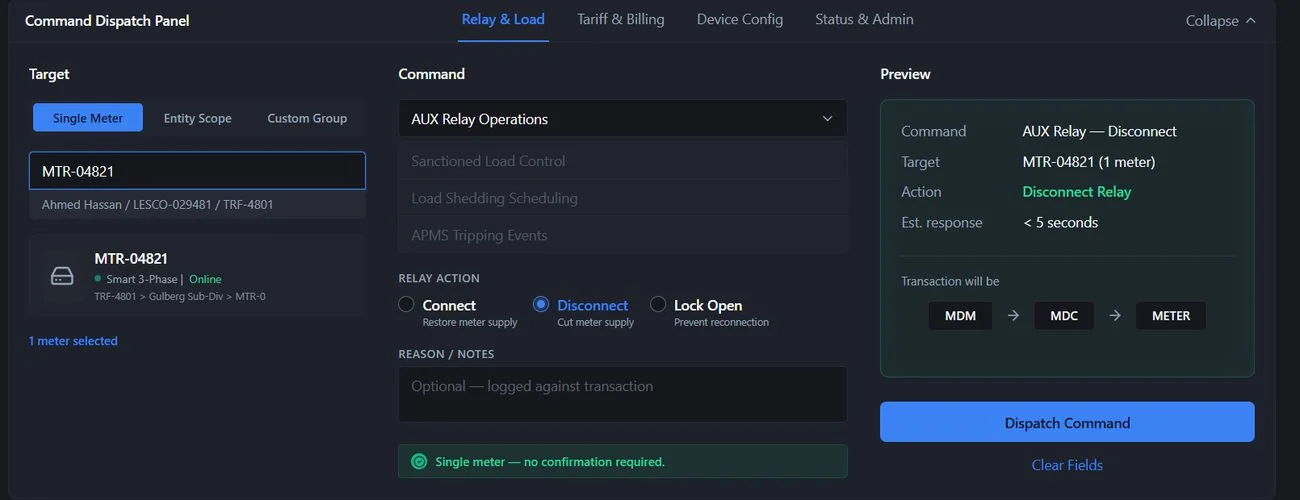
The MetersBoard command dispatch panel — a single meter targeted, an AUX relay disconnect selected, with a preview showing the command routing from MDM through MDC to the meter
Meter commands. Disconnect, reconnect, limit load or push firmware to one meter or thousands — every instruction tracked from platform to meter and back.
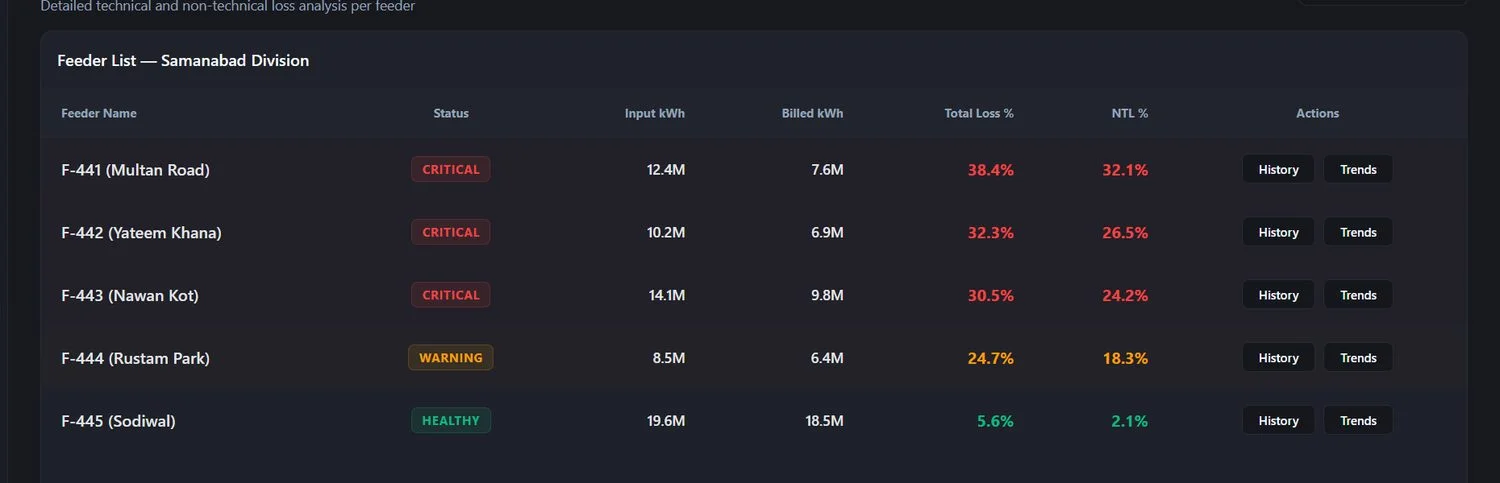
Feeder list for one division — each feeder with status, input and billed kWh, total loss and non-technical loss percentages
Down to the feeder. Technical and non-technical loss per feeder, ranked, with the worst flagged for investigation.
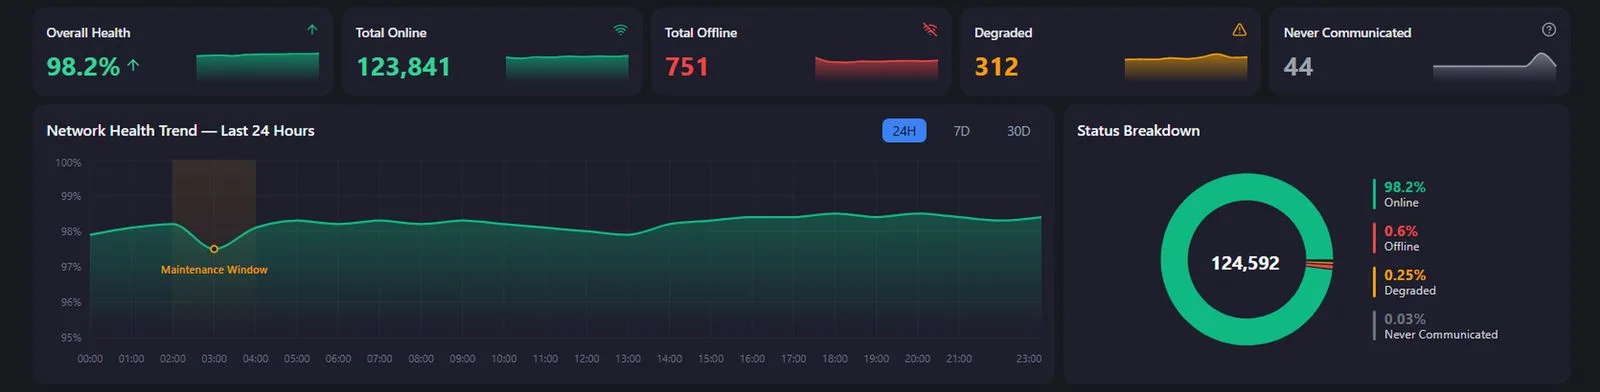
Network health — overall health percentage, meters online, offline, degraded and never communicated, with a 24-hour trend and a status breakdown
Network health. Fleet-wide communication status — online, degraded, offline, or never reported since installation.

Where the units went, one month at a time. Drag the period.

AT&C Loss Waterfall

Where the units went, for one division, one month at a time.

Sample data
AT&C loss this period20.30%
Allowed ceiling11.43%
Units recovered387GWh
Waterfall — Apr 20260255075100100.0Units in3.6Technical12.6Theft andunmetered83.8Units billed4.1Collection shortfall79.7Units recovered
Units in and billedLoss stageRecovered
Period
Apr 2026
Loss stages are computed against feeder input, not against billing alone.

Start at the circle and keep going until you reach one meter. Click any row.

Hierarchy Explorer

Drill from the whole circle down to a single meter.

Sample data
Circle C-1 — total loss8.5%
Non-technical5.4%
Points below5
Divisions — ranked by loss
Network view — abstractedD-1D-2D-3D-4D-5

Node size is connected load, fill is loss against the level average. No basemap, no coordinates, no identifiable geography.

Every identifier on this screen is invented.

Everything under the dashboard

Things others charge extra for

Open, interoperable architecture

Multi-vendor meter and HES supportMQTT, HTTP, CoAP and OPC-UA. DISCOs procure in phases from different vendors over decades; the platform has to outlive all of them.
Works with or without a gatewayTalks straight to meters, or through an existing head-end system, equally well.
Meter commandsConnect, disconnect, load limiting, tariff updates, firmware over the air, on-demand reads and time sync — one meter or thousands, tracked platform to meter and back.
Integration and middlewareAPIs and microservices into ERP, CRM, billing, GIS, OMS and field apps.

Enterprise data and analytics

Time-series storeInterval data and on-demand reads, with intervals as short as one second.
Enterprise scaleBuilt for tens of millions of meters; a single node carries hundreds of thousands.
Validation, editing and estimationAutomated range and continuity checks, with estimation for missing or corrupt intervals — because readings arrive incomplete.
Analytics and reportingLoad profiling, load forecasting and transformer loading analysis.

Billing and tariff

Billing determinant engineValidated interval and register data converted into kWh, kVAh, TOU slabs, power-factor penalties and peak/off-peak differentiation.
Pakistan’s tariff complexitySlab-based domestic, TOU industrial and commercial, and net-metering settlement logic.

Assets, compliance and deployment

Meter inventory and lifecycleStock, procurement, vendor linkage, installation records, meter-to-consumer binding history and field replacement workflows.
Data retention policyConfigurable, and aligned to NEPRA billing-dispute windows and audit requirements.

Deployment models

We operate itManaged, multi-tenantEnercon runs the platform. A DISCO gets its own tenant, its own data boundary and its own users, without procuring infrastructure or standing up an operations team.
You operate itSelf-hostedThe DISCO runs it. Public cloud, private cloud, company intranet or full on-premise — hosting and access control matched to Government of Pakistan data governance expectations.

The full platform lives on its own site

This page is the overview. A demo walks the platform with your own network structure in front of you.

Book a Demo